
Asset Topology Graph
TestNet provides an intuitive Visual Asset Topology Graph that displays the relationships between 8 core asset types, helping security teams inspect attack surfaces from a global perspective.
1. Entering the Graph
- Navigate to the left menu: "Asset Management" → "Assets".
- Click the "Asset Graph" tab or button at the top to load the visualization panel (requires project context).
2. Three Interactive Graph Views
The topology graph includes three visualization layouts to support different analysis workflows:
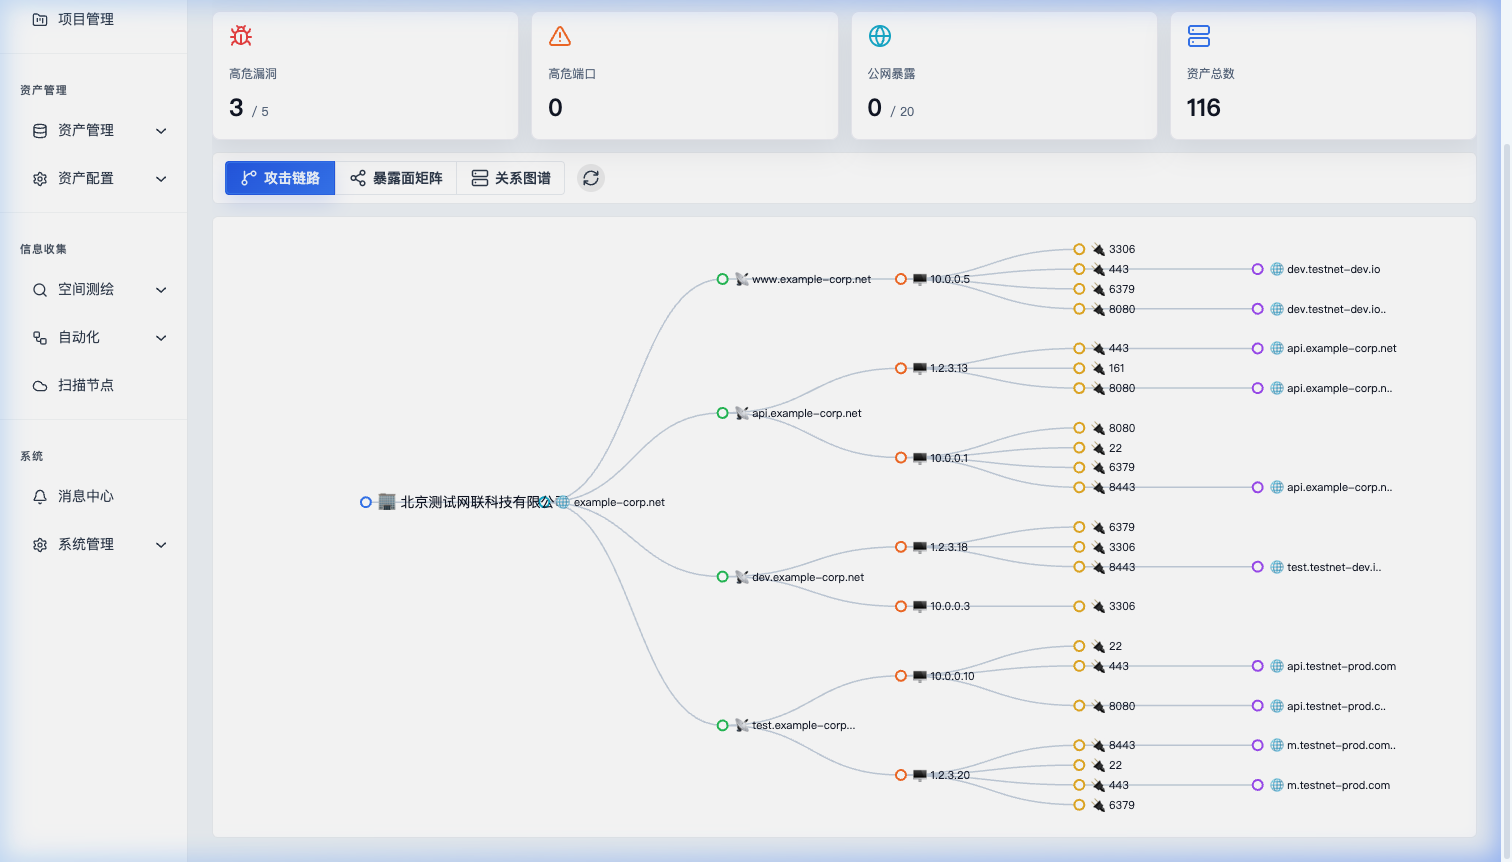
2.1 Force-Directed Layout (Default)
- Visualization: A dynamic network graph where nodes are automatically laid out via physics simulation.
- Use Case: Overall relationship discovery. Helps identify key bridge assets, such as an IP associated with many subdomains, or a host serving a massive number of API endpoints.
- Interaction: Scroll wheel to zoom, drag nodes to reposition them.
2.2 Tree Layout
- Visualization: An hierarchical tree diagram spreading outwards from parent organization or root domains.
- Use Case: Best for tracing asset ownership hierarchies, e.g.,
Company→Domain→Subdomain→Web App→API.
2.3 Sankey Layout
- Visualization: A flow diagram representing the volume flow and connections between different asset types.
- Use Case: Excellent for evaluating distribution proportions across various asset classes.
3. Node Types and Visual Indicators
Nodes in the graph are distinguished by distinct icons, colors, and dimensions:
3.1 Visual Legend & Node Color Palette
At the top-right corner of the canvas, an interactive legend allows you to filter visible node categories with a single click:
- Organization & Domain Layer: 🏢 Company (Blue
#3b82f6), 🌐 Domain (Cyan#06b6d4), 📡 Subdomain (Green#22c55e) - Host & Network Layer: 🖥️ IP Address (Orange
#f97316), 🔌 Port Service (Yellow#eab308) - App & Security Layer: 🌐 Web App (Purple
#a855f7), 🔗 API Endpoint (Pink#ec4899), ⚠️ Vulnerability (Red#ef4444)
Entity Attributes & Hierarchy
The asset attributes and relationships are managed by the 8 core models. See Asset Models.
3.2 Red Risk Halo
If a particular asset node (such as a Web application or IP host) has high-severity vulnerabilities, its node border is highlighted with a glowing red halo (aura) to guide security analysts to prioritize their mitigation.
4. Interaction and Drill-down Analysis
- Node Hover: Hovering over a node displays a tooltip with core attributes (e.g., subdomain CNAME target, port service banners, or HTTP status codes).
- Node Click Drawer:
- Clicking a node slides out the Asset Detail Drawer on the right side.
- The drawer displays key-value metadata, tags, owners, and listed vulnerabilities.
- A "View Details" button navigates directly to the comprehensive CRUD list page for that asset type.
- For Web assets, an "Open Link" button opens the target application directly in a new tab.
Related Documentation
- Asset Models — 8 core asset types and topology relationships
- Asset Overview — Common operations and tag management
- Asset Operations — Batch import/export and change history