
Dashboard
The Dashboard is the default home page after logging in to TestNet. It displays a platform-wide overview of your data and recent activity, helping you quickly understand asset scale, task status, and system health.
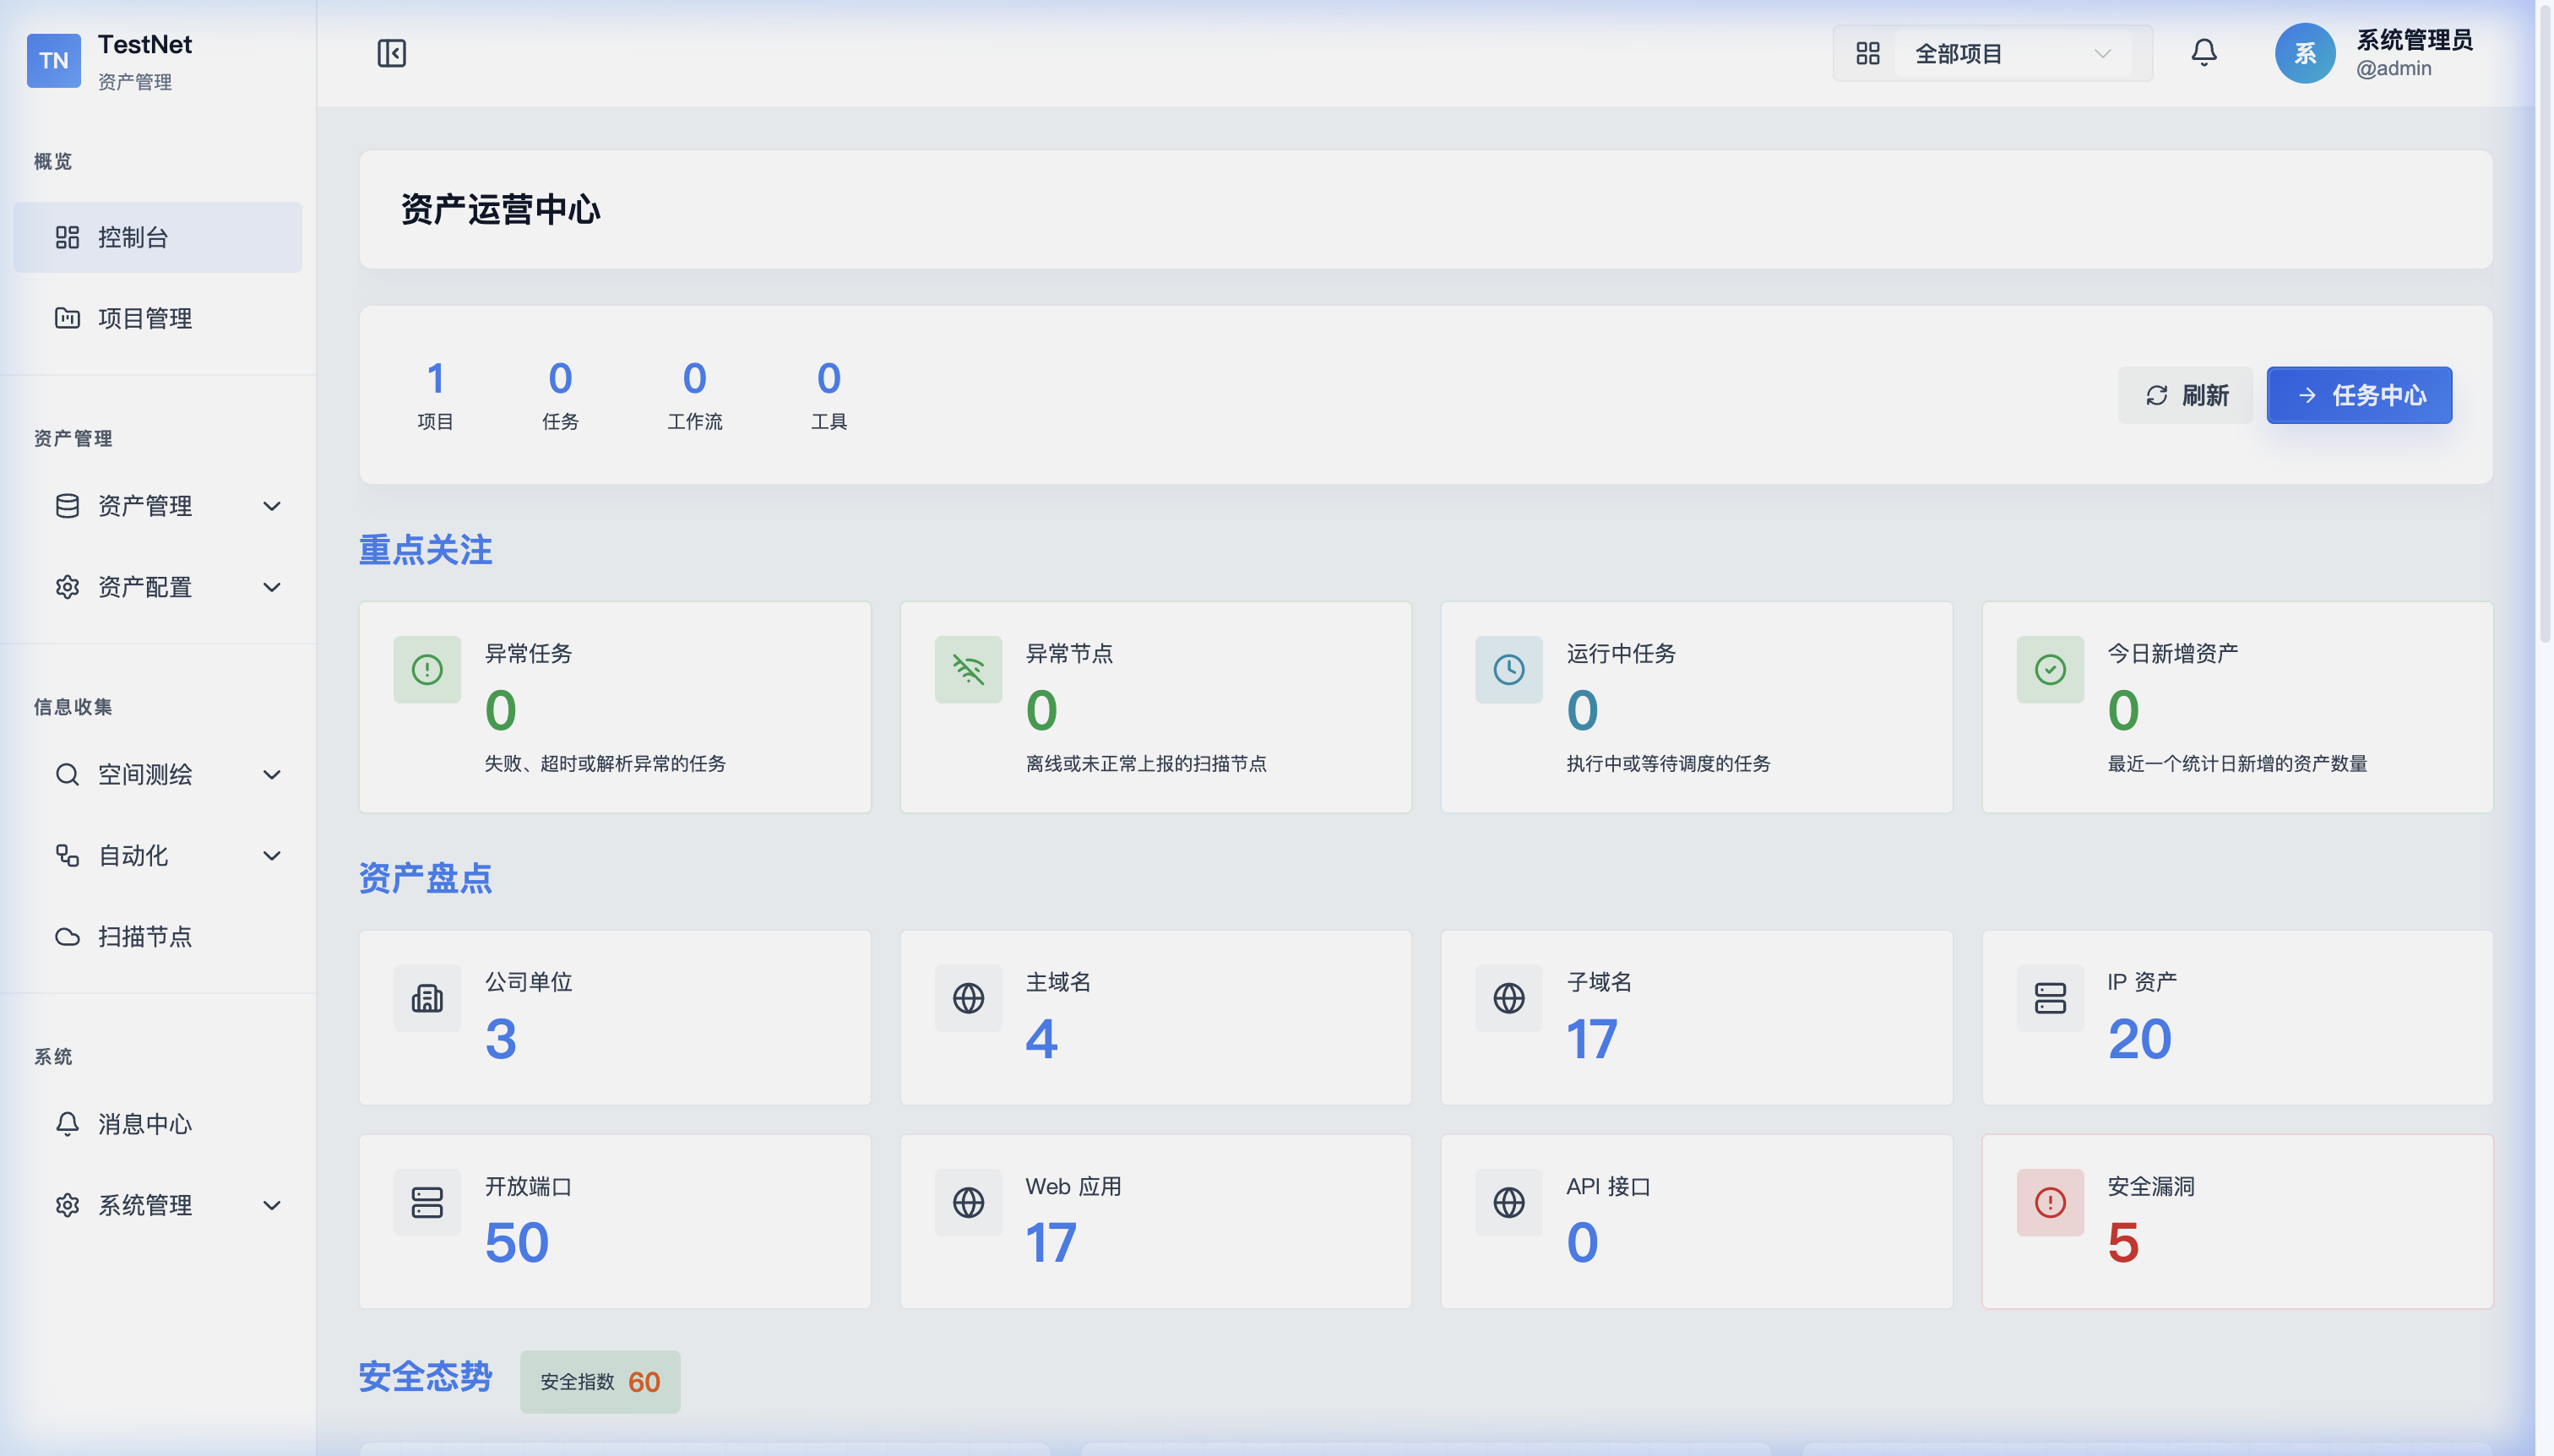
Statistics Panel
The top of the dashboard shows global asset count cards:
| Metric | Description |
|---|---|
| Companies | Number of companies in the current project |
| Domains | Number of top-level domains in the current project |
| Subdomains | Number of subdomains in the current project |
| IPs | Number of IP addresses in the current project |
| Ports | Number of open ports in the current project |
| Web Apps | Number of web applications in the current project |
| APIs | Number of API endpoints in the current project |
| Vulnerabilities | Number of vulnerabilities in the current project |
Project Filter
Dashboard data defaults to the currently selected project. Switching projects via the top-nav project switcher automatically updates all statistics.
Recent Tasks Overview
Displays the status distribution of recently executed scan tasks:
| Status | Icon | Meaning |
|---|---|---|
| RUNNING | 🔄 | Tasks currently executing |
| COMPLETED | ✅ | Tasks completed today |
| FAILED | ❌ | Tasks failed today |
| PENDING | ⏳ | Tasks waiting for assignment |
Click a status card to jump to Task Management filtered by that status.
Node Status
Shows the number of online scanning nodes vs. total nodes:
Online Nodes: 3 / 5 Total- 🟢 Online: Running normally, ready to accept tasks
- 🔴 Offline: No heartbeat received for more than 5 minutes
Click to navigate to the Scanning Nodes management page.
Recent Activity
Displays recent platform operations and automated events:
- Workflow execution start/completion notifications
- Newly discovered asset records
- Important system event alerts
Next Steps
- Asset Management — View and manage all assets
- Workflows — Create and run automated scans
- Task Management — Monitor scan task execution